Tutorial
Grafana pdc-agent as a Service
Set up a pdc-agent as a service to connect Prometheus to Grafana on Ubuntu 24.04
This post contains paid links (affiliate) — how that works.
Contents
- Introduction
- Get pdc-agent Credentials
- Download the pdc-agent
- Download
- Extract
- Prepare Executable
- Make executable
- Clean Up
- Set Permissions
- Credentials
- Create Environmental Variables
- Add Credentials
- Create the Service
- Open with Nano
- Add the Configuration
- Start the Service
- Reload
- Start
- Enable
- Verify
- Connect to Grafana
- Add Prometheus Data Source
- Gear used
Introduction
This guide will provide instructions on how to set up a Grafana pdc-agent as a service in Ubuntu 24.04
- What is a pdc-agent?
Get pdc-agent Credentials
In Grafana, open up the side menu and select "Private data source connect"
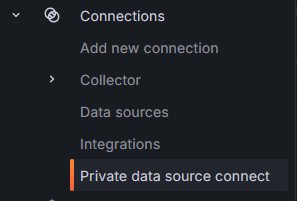
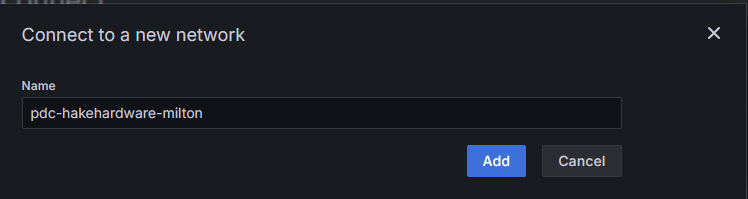
If the network does not already exist, select "Add new network". Then provide a name
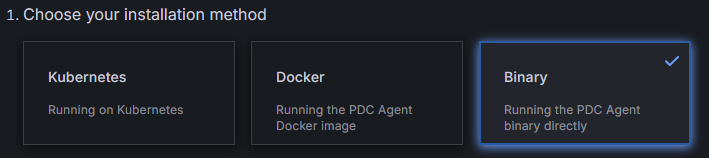
Select the "Binary" option
Click the button to create a token. A token will be generated, scroll down to step 3 and find the section that states "Run the binary". Copy the command into a notepad, this will be needed for later.
Download the pdc-agent
Navigate to the pdc-agent Download Page and locate the release with the "Latest" tag. At the time of this wiki the latest version is pdc-agent_Linux_x86_64.tar.gz and it will be used as an example in future commands within this wiki.
Download
Download the latest version to the home directory
wget -P ~/ https://github.com/grafana/pdc-agent/releases/download/v0.0.36/pdc-agent_Linux_x86_64.tar.gzExtract
Extract the downloaded file
tar -xvf ~/pdc-agent_Linux_x86_64.tar.gzMove the extracted files
sudo mv ~/pdc-agent_Linux_x86_64/pdc /usr/local/bin/pdcPrepare Executable
Make executable
Make the pdc binary executable
sudo chmod +x /usr/local/bin/pdcClean Up
Delete the tar.gz file
rm -rf ~/pdc-agent_Linux_x86_64*Set Permissions
Set permissions
sudo chown -R $USER:$USER /usr/local/bin/pdcCredentials
Create Environmental Variables
Create a file to store sensitive values as environmental variables
sudo nano /etc/default/pdc-agentAdd Credentials
Open the notepad that you saved the command from earlier. Paste in the values provided by Grafana for your pdc-agent. Then press ctrl + x, then y, then enter to save.
GCLOUD_PDC_SIGNING_TOKEN="your_signing_token_here"
CLUSTER="your_cluster"
GCLOUD_HOSTED_GRAFANA_ID="your_grafana_id"-tokenis the GCLOUD_PDC_SIGNING_TOKEN-clusteris the CLUSTER-gcloud-hosted-grafana-idis the GCLOUD_HOSTED_GRAFANA_ID
Create the Service
Open with Nano
Use nano to create a pdc-agent.service file
sudo nano /etc/systemd/system/pdc-agent.serviceAdd the Configuration
Add the following configuration, then press ctrl + x, then y, then enter to save.
[Unit]
Description=PDC Agent
After=network.target

[Service]
Type=simple
EnvironmentFile=/etc/default/pdc-agent
ExecStart=/usr/local/bin/pdc -token $GCLOUD_PDC_SIGNING_TOKEN -cluster $CLUSTER -gcloud-hosted-grafana-id $GCLOUD_HOSTED_GRAFANA_ID
Restart=always

[Install]
WantedBy=multi-user.target
Start the Service
Reload
Reload the daemon
sudo systemctl daemon-reloadStart
Start the service
sudo systemctl start pdc-agentEnable
Enable the service
sudo systemctl enable pdc-agentVerify
Verify the service is running
sudo systemctl status pdc-agentConnect to Grafana
Now go back to the "Private data source connect" page in Grafana. Click "Test agent connection". The "agents connected" should now state "1".
Add Prometheus Data Source
Now that Grafana is connected to the local pdc-agent, Prometheus can be added as a data source if it is already configured. If it has not been configured yet, it can be installed as a service.
In the menu select "Data Sources".
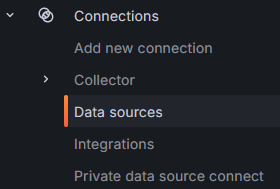
Select "Add new data source". Then select "Prometheus". Set the "Name" for the data source.

Enter in http://<YOUR IP>:9090 as the Prometheus server URL. Where it says <YOUR IP> use the internal IP for the PC running the pdc-agent. This can be found with ip a.

Scroll all the way to the bottom and click the dropdown for "Private data source connect" and choose the data source you just set up.
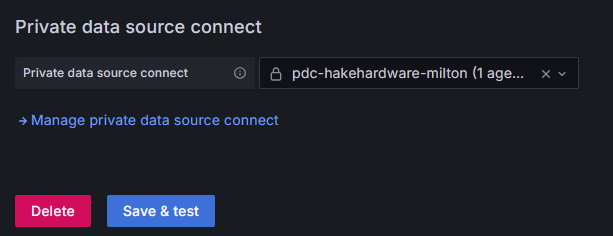
Then click "Save & Test". You should receive a success message
