Tutorial
Node Exporter Service
How to install Node Exporter as a Service on Ubuntu 24.04
This post contains paid links (affiliate) — how that works.
Contents
Introduction
This guide will provide instructions on how to install Node Exporter as a service in Ubuntu 24.04.
- What is node_exporter?
Prerequisites
Prometheus should be set up. Grafana should be connected to your Prometheus instance.
Download and Install node_exporter
Navigate to the node_exporter download and locate the release with the "Latest" tag. At the time of this wiki that is node_exporter-1.8.2.linux-amd64.tar.gz and it will be used as an example in future commands within this wiki.
Download the latest version to the home directory:
wget -P ~/ https://github.com/prometheus/node_exporter/releases/download/v1.8.2/node_exporter-1.8.2.linux-amd64.tar.gzExtract the downloaded file:
tar -xvf ~/node_exporter-1.8.2.linux-amd64.tar.gzMove the extracted files:
sudo mv ~/node_exporter-1.8.2.linux-amd64/node_exporter /usr/local/bin/Remove the unneeded files:
rm -rf ~/node_exporter-1.8.2.linux-amd64*Create the node_exporter user:
sudo useradd -r -s /bin/false -c "Node Exporter service account" -d /nonexistent node_exporter- '-r': Creates a system account with a UID < 1000, typically used for system services.
- '-s /bin/false': Disables shell access for the user.
- '-c' "Node Exporter service account": Adds a comment for clarity.
- '-d /nonexistent': Sets the home directory explicitly to a non-existent directory, further ensuring the account is restricted.
Set the user permissions:
sudo chown node_exporter:node_exporter /usr/local/bin/node_exporterCreate the service:
sudo nano /etc/systemd/system/node_exporter.serviceAdd the following configuration:
[Unit]
Description=Node Exporter
Wants=network-online.target
After=network-online.target

[Service]
User=node_exporter
Group=node_exporter
Type=simple
ExecStart=/usr/local/bin/node_exporter

[Install]
WantedBy=multi-user.target
Save with Ctrl+X, Y, Enter.
Reload the daemon:
sudo systemctl daemon-reloadStart the service:
sudo systemctl start node_exporterEnable service to start on boot:
sudo systemctl enable node_exporterVerify the status:
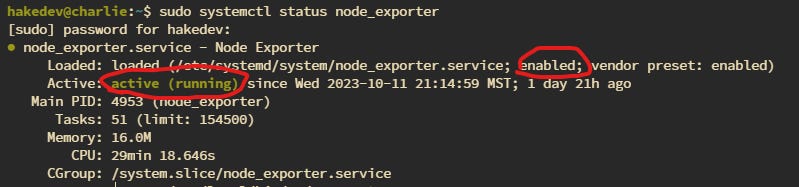
sudo systemctl status node_exporterYou should see it is enabled and active
Update Prometheus Config
Update the Config
Open up the prometheus config:
sudo nano /etc/prometheus/prometheus.ymlThen add a new job for node_exporter:
  - job_name: 'node_exporter'
    static_configs:
      - targets: ['localhost:9100']
        labels:
          instance: '<hostname>'
If the PC that you are installing node_exporter on is not the host that is running prometheus, then you should use the IP of the host that you are installing node_exporter on instead of localhost.
Restart the prometheus service:
sudo systemctl restart prometheusVerify Target is Up
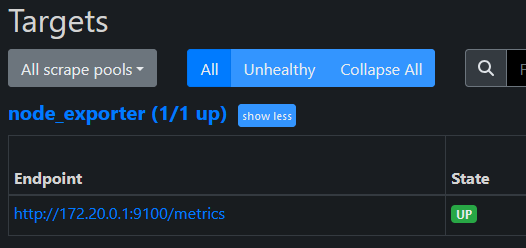
To be sure the node_exporter target was loaded, check the web frontend for Prometheus. Click the "Status" menu item in the navbar and then the "Targets" menu item to see all connected targets
Importing the Dashboard
There is a default dashboard that you can import to get started. Open up Grafana, go to "Dashboards" and then click the button "New", from the dropdown select "Import". Then enter 1860 where it says "URL or ID". Then click "Load"
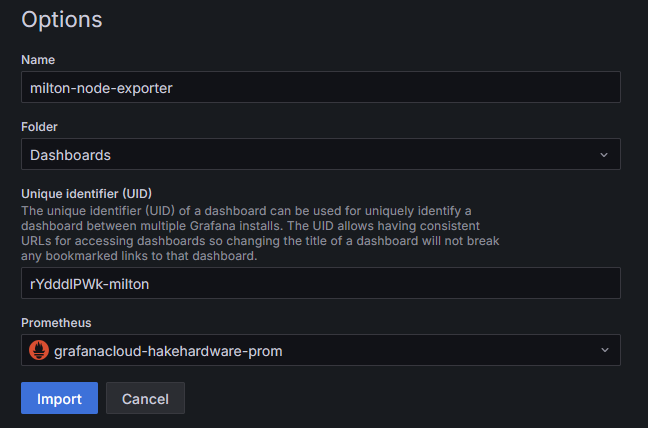
I usually make the name a bit more descriptive and change the UID slightly as well. Then select the Prometheus data source you set up. Finally click "Import"
You should see the dashboard load with the default layout.
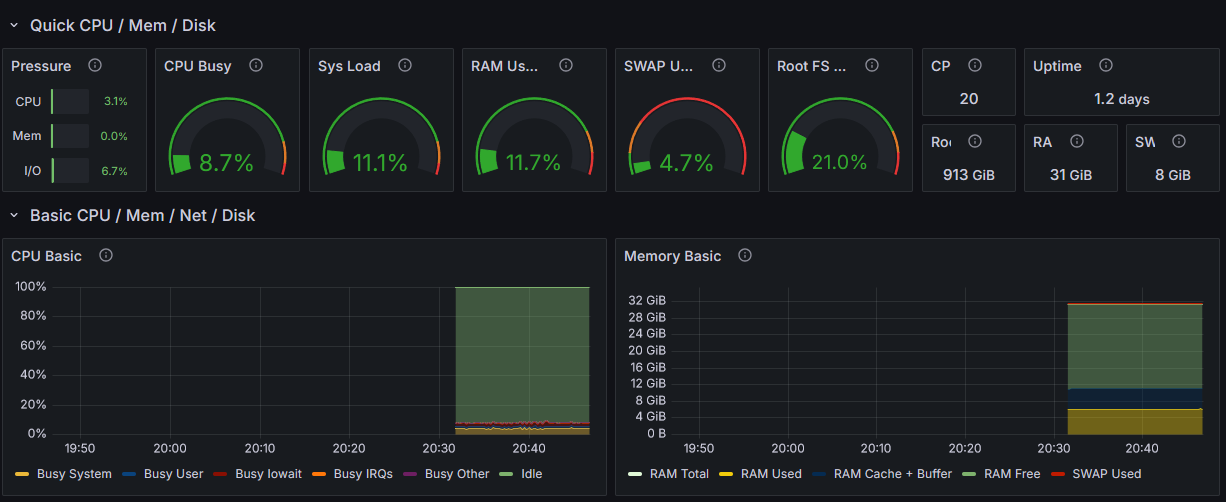
And that's it! You can now monitor your PC easily from anywhere. You can even add alerts and other cool things, but that is outside the scope of this guide.