Tutorial
Windows Exporter
This guide will provide instructions on how to install Windows Exporter on Windows 11
This post contains paid links (affiliate) — how that works.
Contents
Introduction
This guide will provide instructions on how to install Windows Exporter on Windows 11.
Prerequisites
In order to use Windows Exporter you should have Prometheus and Grafana running.
Download Windows Exporter
Download Latest
The first step is to navigate to the Windows Exporter Releases page and get the latest version. At the time of this wiki that is version windows_exporter-0.29.2-amd64.msi and this will be used in the wiki as an example.
Install
You will receive a security notice from Windows when you attempt to install. If you accept the security risks, click "More Info" and then "Run Anyway".
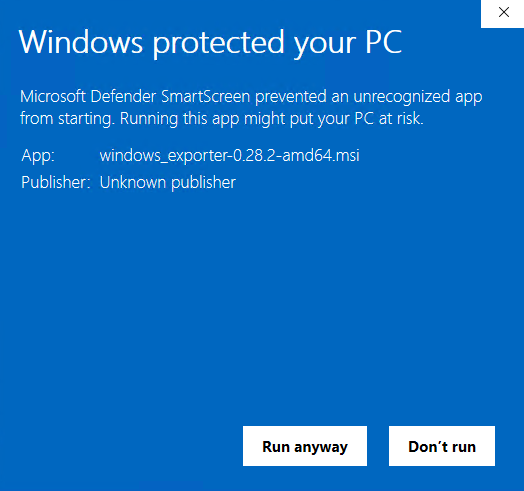
Click the "Yes" on the pop up to run with Admin privileges. The installer will pop up, click "Next" to begin. If Windows Exporter will be running on a different host than Prometheus, you must install the firewall exception so that Prometheus can connect to the Windows Exporter endpoint over the network.
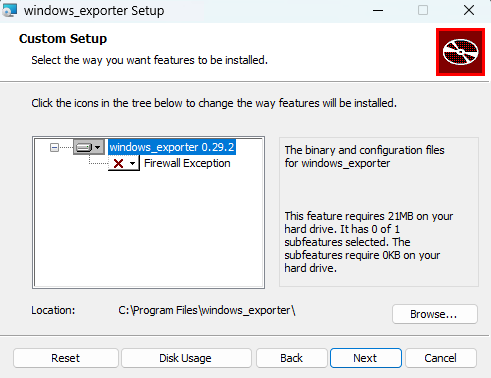
Click next to move to the configuration section. I use the defaults, but the Windows Exporter GitHub page can be referenced for available options. Click "Next" when ready. Windows Exporter will be installed to C:\Program Files\windows_exporter which will also have the config file if you wish to make any changes.
Update Prometheus
In order to scrape the metrics with Prometheus, update the prometheus.yml file with the following:
  - job_name: 'windows_exporter'
    scrape_interval: 15s
    static_configs:
      - targets: ['localhost:9182']
Make sure to update localhost with the IP of the host you installed Windows Exporter on if it is not the same host that Prometheus is running on.
Verify
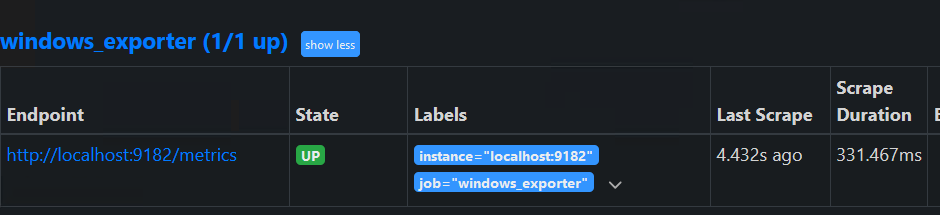
Open up the Prometheus web front end and then select "Status" and then "Targets". You should see a section for "windows_exporter" and that the state is UP. If it says "UNKNOWN" give it a little bit of time and then click refresh.
Grafana Dashboard
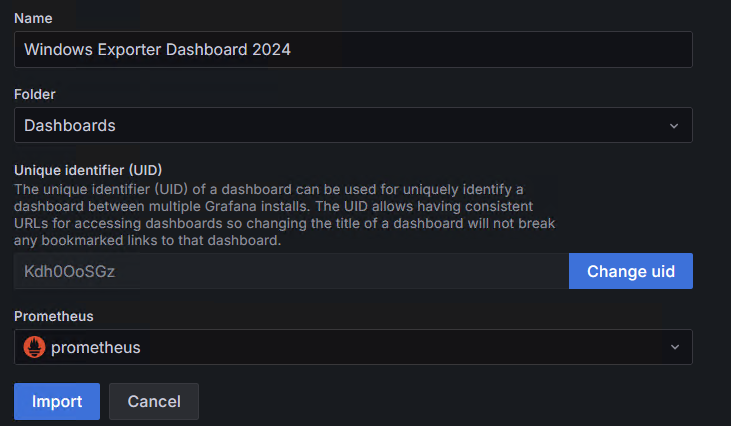
Open up Grafana and go to "Dashboards". Then click "New" and then "Import". Paste 20763 into the Grafana ID input. Then click "Load". You should see the Windows Exporter Dashboard load. I prefer to make my UID unique by adding the hostname to it, this is helpful if you have multiple hosts that will have a dashboard as the UID must be unique. Select your Prometheus data source. Click "Import" when ready.
Once imported, you should see the dashboard
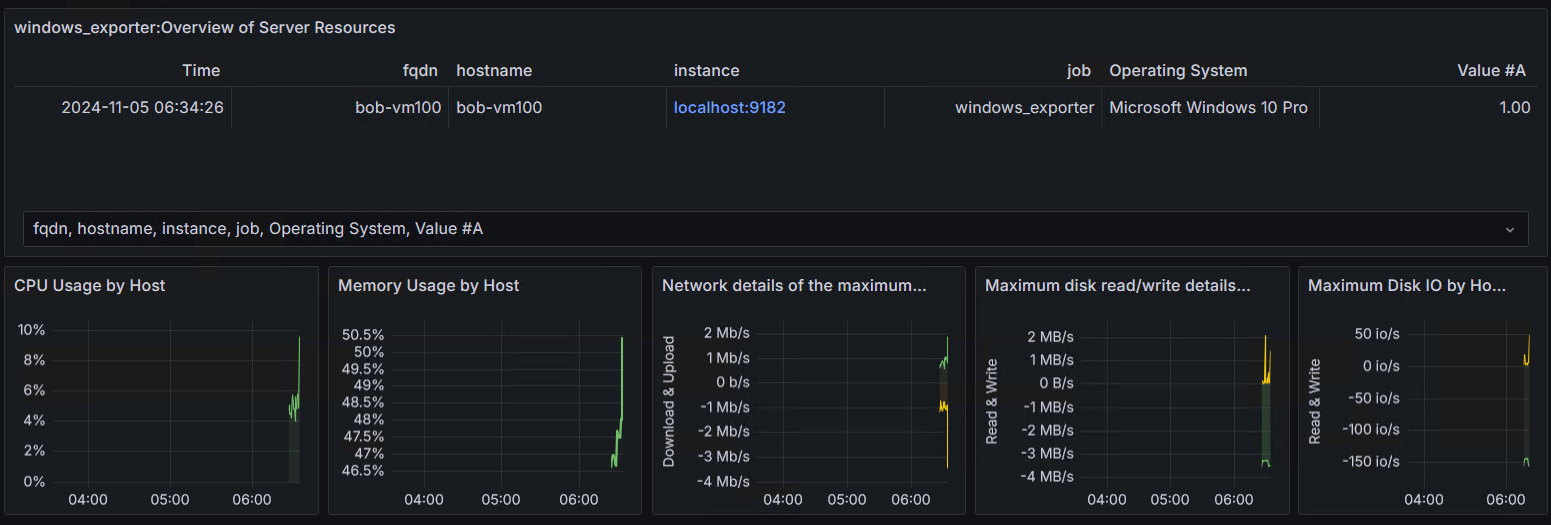
And that is it! Happy monitoring.